The $340-Per-Day Bleed Why Most Waste Collection Teams Still Can’t Crack the 800‑Stop Route Problem (And the Hidden Compactor Math They’re Missing)
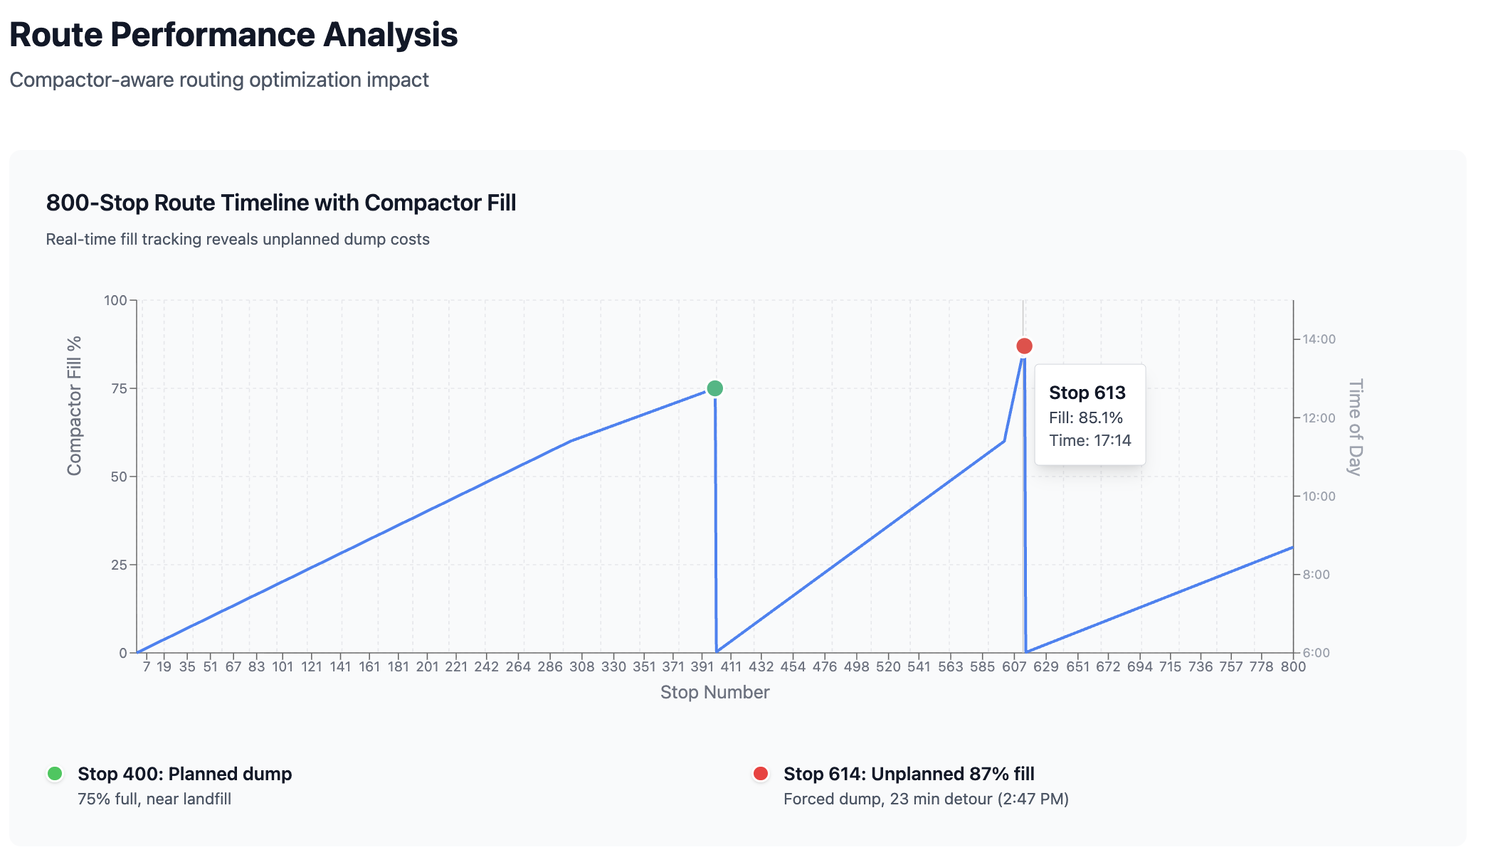
t’s 2:47 PM. Your driver is 614 stops into an 800‑stop residential route. The route plan in your system still looks “green.” On paper, you’re on time, on budget, on track.
In the real world, the compactor just hit 87% capacity. The nearest landfill is 23 minutes away in light traffic. There’s a lane closure on the usual approach. And you still have a school zone and a cul‑de‑sac cluster ahead.
The Route timeline
Your entire afternoon route just imploded. Overtime kicks in, fuel spend spikes, and the “one more mid route dump” quietly eats a few hundred dollars of margin… again.
Route optimization in waste collection isn’t a neat travelling salesman puzzle. It’s a daily knife fight between physics, geography, regulations, and whatever your city decided to dig up this week. Modern guidance puts efficient automated side‑loader routes at roughly 800–1,200 stops on a 10‑hour day, depending on container type and context.
That’s the scale of complexity most teams are still managing with spreadsheets, highlighters, and tribal knowledge.
This article is about that reality and the compactor math almost nobody models, but every operator pays for.
Why 800-1,200 stops is not “just another route”
If you manage residential MSW, recycling, or organics, you already know the headline numbers:
A single route can easily handle 800-1,200 stops per day for automated side loaders on 8-10 hour shifts, with lower but still intense counts for rear load operations.
Trucks are increasingly fitted with high‑capacity compactors to reduce trips to disposal sites, save fuel, and lower emissions.
Cities that invest in route optimization regularly report double‑digit reductions in routes, miles, and trips to the landfill.
On a slide deck, this looks simple: “optimize routes, reduce miles, save 10-30% in fuel, save tens of thousands per year.”
In the cab, it looks very different.
Your driver is not driving a clean line through a grid. They are dancing through:
Service‑side collection rules (right‑hand vs left‑hand, alley access, backdoor pickups).
One‑way streets and no‑go zones for heavy vehicles.
School zones and time‑of‑day restrictions.
Seasonal yard waste spikes that make “average load per stop” a lie for three months.
Compactor capacity that turns “one more street” into “one more 40‑minute dump trip.”
This is not just a distance/time problem. It’s a capacity‑over‑time problem with hard stops, changing regulations, and human fatigue built in.
The hidden villain: compactor math (and why your “optimized” routes still bleed cash)
Most “optimization” logic in legacy tools still behaves like this:
Minimize distance and/or drive time.
Respect basic time windows (e.g., no 6 AM pickups by a school).
Balance stops across routes to hit a target like 800–1,000 stops per day.
What it rarely does well is treat compactor capacity and dump cycles as first‑class constraints.
But that’s where a big chunk of your daily bleed lives.
How compactor math actually behaves
Every truck has:
A compactor body with finite volume and payload.
Local axle and road limits that restrict usable capacity.
A pattern of dense vs light segments: heavy apartment complexes, then light residential, then commercial with bulky waste.
If you ignore this and just “pack 900 stops into a route,” you get patterns like:
Hitting 90–100% capacity far from the disposal site, forcing a long mid‑route dump with no productive work on the way.
Over‑loading “heavy” neighbourhoods on the same route, guaranteeing extra dumps and overtime.
Under‑utilising trucks on lighter routes that could easily absorb more stops if compactor capacity was considered properly.
Industry guidance even suggests using “units per dump” and “one dump ≈ half‑day route” as practical planning increments. Yet most planning still treats dumps as an afterthought.
In other words: you’re optimizing the pretty line on the map, not the physics of a filling truck.
The $340‑per‑day bleed (and why you don’t see it on your P&L)
Let’s walk through a realistic, simplified scenario.
Your automated side loader route is planned for 900 stops.
The truck averages two dumps per day in the ideal case (start‑of‑day and mid‑day), each costing:
Now imagine poor compactor planning adds just one extra dump every other day on that route:
Extra time: ~40 minutes of non‑productive driving and waiting.
Extra fuel: a few litres on a heavy truck.
Knock‑on effect: overtime, missed stops that roll to the next day, or the need for backup routes.
Even with conservative assumptions, that third dump can easily represent a couple of hundred pounds/dollars in blended cost when you factor in:
Labour (including overtime multipliers).
Fuel at today’s prices.
Increased maintenance from extra miles and compaction cycles.
Spread across a small fleet, it’s not hard to arrive at an average bleed in the low hundreds per day per depot when compactor‑induced dumps are not planned intentionally.
Industry reports repeatedly show that a 10% reduction in miles and dump trips can save tens of thousands per year for mid‑sized waste fleets.
Where the Money Leaks for Waste Collection
The point isn’t whether your number is exactly $340. The point is that you are almost certainly bleeding a similar order of magnitude every day if compactor capacity and dump timing are not explicit design variables.
The multi‑variable nightmare: what your planners juggle in their heads
Talk to any experienced routing supervisor and they’ll tell you: “The map is lying to you.”Here’s what they’re actually juggling:
Service‑side rules You cannot just zig‑zag. Side‑loader arms, alley access, and cul‑de‑sacs dictate approach direction and turn patterns, not your algorithm’s “shortest route.”
One‑way and restricted streets Older neighbourhoods, weight‑restricted bridges, school zones plenty of roads are “technically” available on a map but practically off‑limits in a 26‑tonne truck.
Seasonality and set‑out rates Spring yard waste, holiday packaging spikes, random weather events: “average weight per stop” is misleading when some weeks double the volume in a few postcodes.
Compactor fill profiles Heavy commercial stop clusters early in the route can push the truck toward capacity much earlier than a model based only on distance or stop count would predict.
New regulatory pressure In the UK, for example, “Simpler Recycling” reforms, new segregation rules, and penalties for non‑compliance are changing how routes are structured and monitored.
The result: planners lean heavily on experience and intuition, and most organisations are one retirement away from losing the only person who knows why Route 14 “cannot start on that cul‑de‑sac” in March.
Why legacy tools keep failing you
Most older systems and spreadsheet‑driven processes share three blind spots:
They optimise static routes, not live reality Routes might be re‑planned every few years or after major growth, rather than continuously adjusted for new developments, different set‑out rates, or household growth.
They treat the truck as infinite until the landfill Capacity is handled as a rough “two dumps per day” rule of thumb, not as a dynamic variable tied to expected weight per stop, compaction ratio, and geography.
They optimise for the wrong KPI Many tools still focus on miles and drive time as the primary outcome. But in 2026, operators are equally focused on: Labour utilisation and avoiding overtime, Safety and driver wellbeing in tight residential areas and Regulatory compliance and service reliability as competitive advantage.
In other words, you can have a route that is “efficient” on a map and terrible for the driver, the truck, and your P&L.
The 3‑Horizon Planning Framework for waste routes
Here’s where you can shift from “we’re surviving” to “we’re designing.”
Think of waste route planning in three horizons:
Horizon 1: Immediate (daily/weekly) – live compactor‑aware routing
Objective: Stop bleeding cash today.
Integrate compactor capacity and expected weight per stop into daily route generation.
Use historical fill patterns to predict where and when each truck will hit 70–80% capacity.
Place dumps intentionally:
Close to the disposal site when fill is predicted to peak at 70 - 80%.
Near natural route seams, at the end of dense clusters not mid-street.
Away from peak traffic windows and school zones.
Deliverable: A daily route plan that expects dumps instead of being surprised by them.
Horizon 2: Structural (quarterly) – redesign routes for balanced “units per dump”
Objective: Stop fighting the same structural problems over and over.
Use KPIs like:
Average stops per route by collection type.
Units per dump as a core design metric.
Miles per day and set‑out rates by area.
Re‑draw route territories so:
Heavy and light areas are balanced.
Each route tends toward a stable pattern: “two well‑timed dumps per day” rather than a roulette of one, two, or three.
Growth can be absorbed without immediate rework.
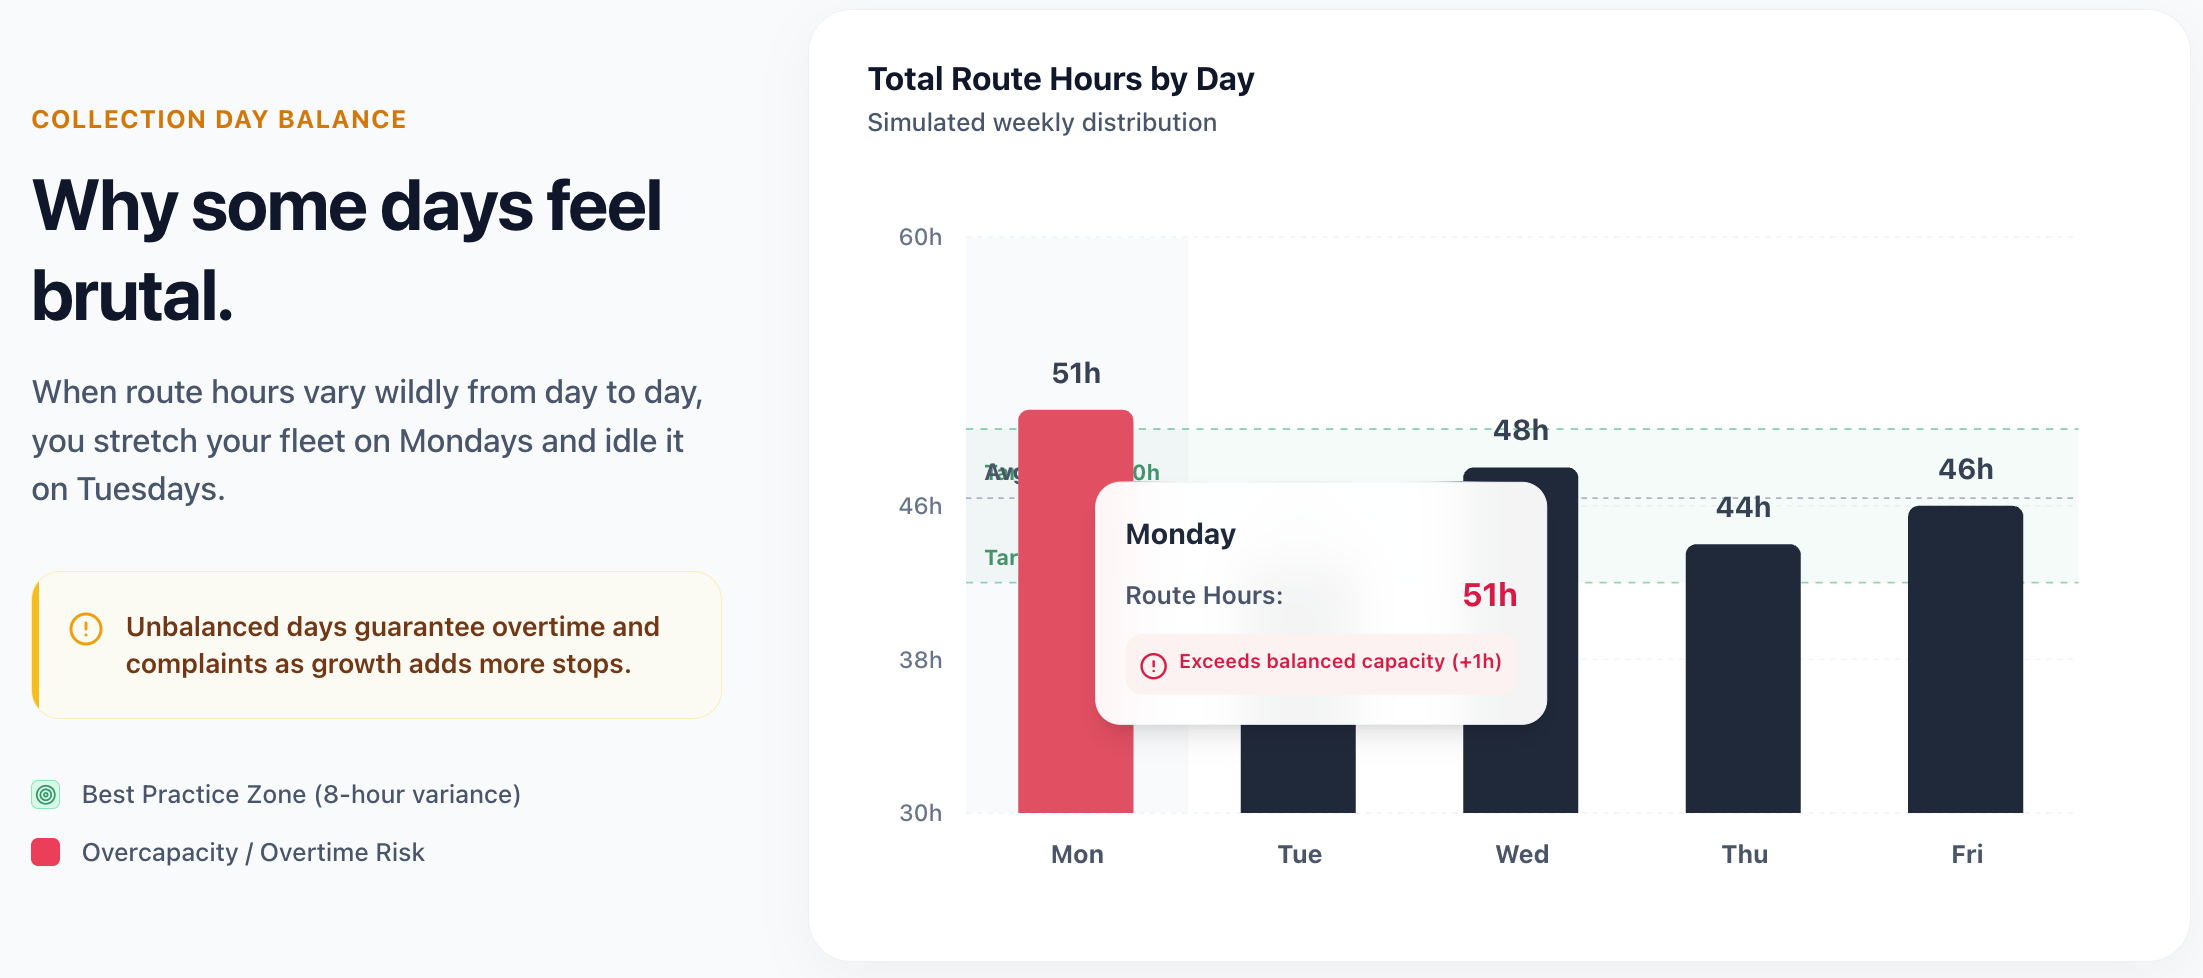
The effect of imbalance route planning for Waste Collection service providers
Deliverable: A playbook where each route has a clear design intent (“this is a two‑dump, 1,000‑stop, heavy‑on‑Mondays route”) instead of being a historical accident.
Horizon 3: Strategic (annual/multi‑year) – align fleet, regulation, and technology
Objective: Use routes as a strategic advantage, not just an operational chore.
Factor in:
Upcoming regulatory changes and recycling reforms.
Planned housing growth and new commercial zones.
Fleet renewal (new compactor sizes, different loader types).
Run “what if” scenarios:
“What if we move organics to different days to smooth compactor utilisation?”
“What if we upsize/ downsize compactors on certain routes?”
“What if we add dynamic routing for smart bins or demand‑responsive collection?”
Deliverable: A three‑year roadmap where your routing, fleet, and compliance strategy actually talk to each other.
What this looks like in practice (and where Syncnox fits)
If you do this right, your day stops looking like “react to today’s chaos” and starts looking like:
Planners working with live data on stop density, fill patterns, and dump cycle predictions.
Drivers seeing realistic routes that respect how their trucks fill and where they can safely manoeuvre.
Finance seeing a meaningful drop in miles, dumps, overtime, and “mystery variance” between planned and actual cost per route.
A platform like Syncnox can sit at the centre of this by:
Modeling routes with compactor‑aware capacity constraints and real‑world side‑of‑street rules.
Continuously learning from actual run data (GPS traces, fill times, dump timestamps).
Connecting route planning, driver scheduling, and task assignment so you don’t fix one part of the system while breaking another.
Because at the end of the day, your $90K garbage truck is not just a vehicle. At current fuel prices, labour rates, and disposal fees, it’s a rolling $2.50‑per‑gallon time bomb if you’re ignoring the math of a filling compactor.
The operators who get this right are not just “saving miles.” They’re quietly winning on safety, reliability, and margin while everyone else is still redrawing lines on a map.
_page-0001%20(1).jpg)

_page-0001.jpg)
_page-0001.jpg)
_page-0001.jpg)
.svg)
.png)
.png)
.png)